

Anyone who can read in *.raw chromatography files and save the chromatogram as a PDF file for us? #GCMS #LCMS #chromatography #chemistry #analytics #Xcalibur
Recent searches
Search options
Administered by:
#chromatography
0 posts0 participants0 posts today

chromConverter 0.7.5 is finally available on CRAN! Major changes since v0.2.1 include support for 10+ new file formats (Shimadzu LCD/QGD, Agilent D, Varian SMS, Allotrope ASM, ANDI MS/CHROM, mzML), parallel processing, and improved metadata extraction.
https://cran.r-project.org/web/packages/chromConverter/index.html
#rstats #CRAN #chromatography #opendata
My first first-authored #scientific #publication as a former #postdoc at ICTA-UAB, published in #Journal of #Chromatography A one year and a half ago, deserves a #thread on #Mastodon as well!
We selectively extract #levoglucosan and its isomers from complex matrices, such as #sediments, for quantification by liquid chromatography-electrospray ionization-tandem mass spectrometry (LC-ESI-MS/MS)!
#Science #ScienceMastodon #Paper
#LiquidChromatography #MassSpectrometry
https://doi.org/10.1016/j.chroma.2023.463935 (1/28)
#TIL that the output of size exclusion #chromatography (sec) can be called an elugram, presumably derived from elution volume/time, and I love it so much #chemistry #chemiverse
Continued thread

This was my first time working with ube extract, and DANG is that stuff strong!
I was incredibly amused to find that when I wiped up some spilled extract with a damp paper towel, it did the same kind of chromatography as my fountain pen inks.
It's so pretty! I couldn't quite get it to show up right but I did my best to tweak it a little - the actual color is that vibrant shade of purple the camera can never quite capture.
2/2


#2LabsToGo: Build your own #OpenSource #chromatography equipment including biological #assay & effect #detection:
-solvent-resistant
-#3Dprinted components
#Arduino-/#PiCam-controlled
https://doi.org/10.1021/acs.analchem.2c02339
#DIYbio #DIYchem #lab #instruments #analytics #TLC #chemistry
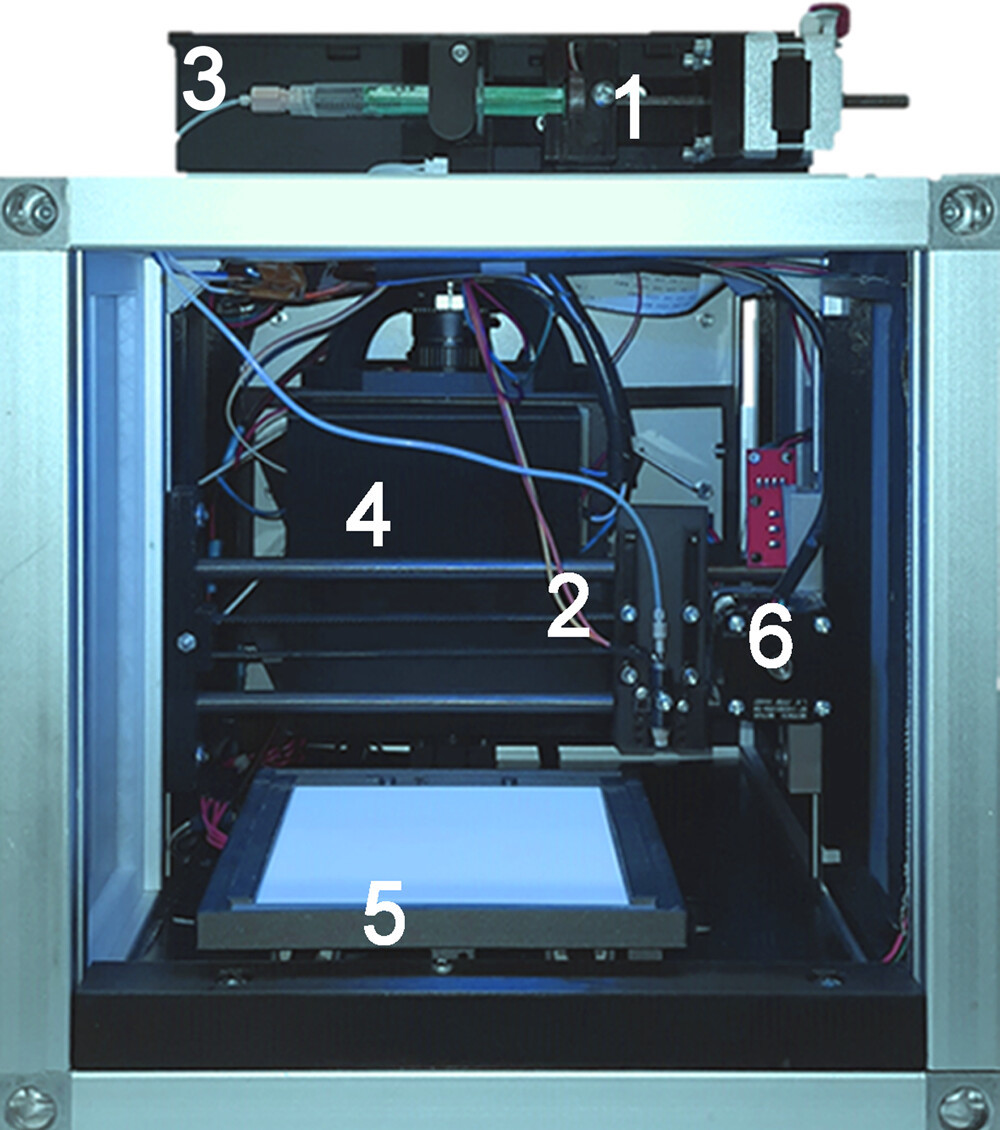
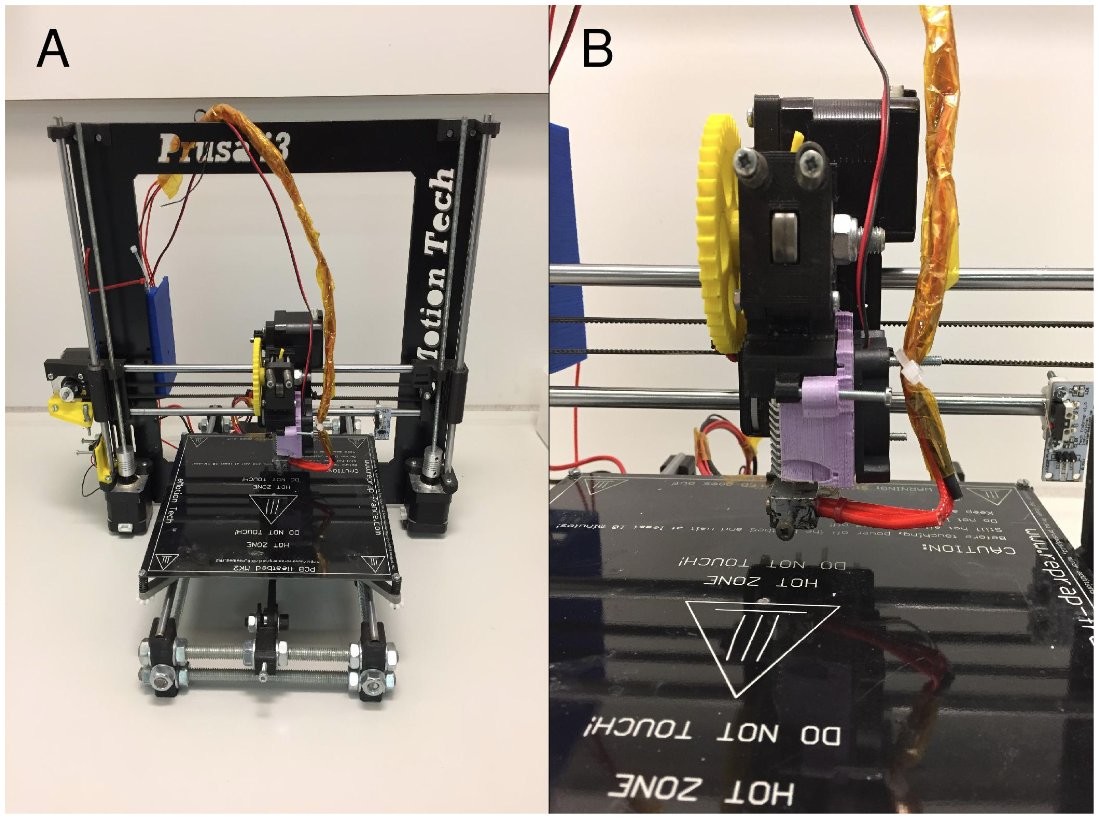
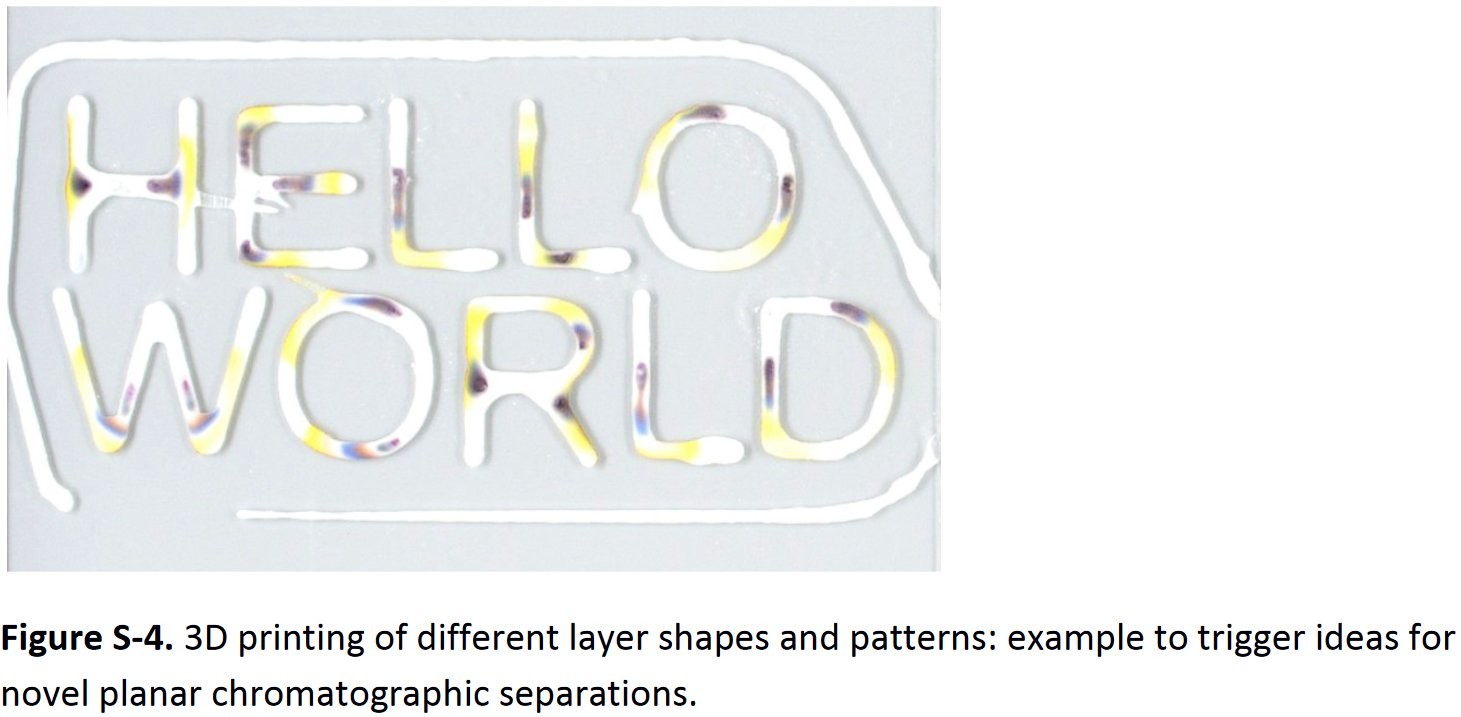
#OpenSource-based #3Dprinting of thin #silica #gel layers in planar #chromatography:
-slurry doser replaces plastic extruder of #Prusa i3 #3Dprinter
-#NOpenAccess article
https://doi.org/10.1021/acs.analchem.6b04813
#DIYbio #lab #instruments #TLC #3Dprinting #DIYchem #chemistry #analytics
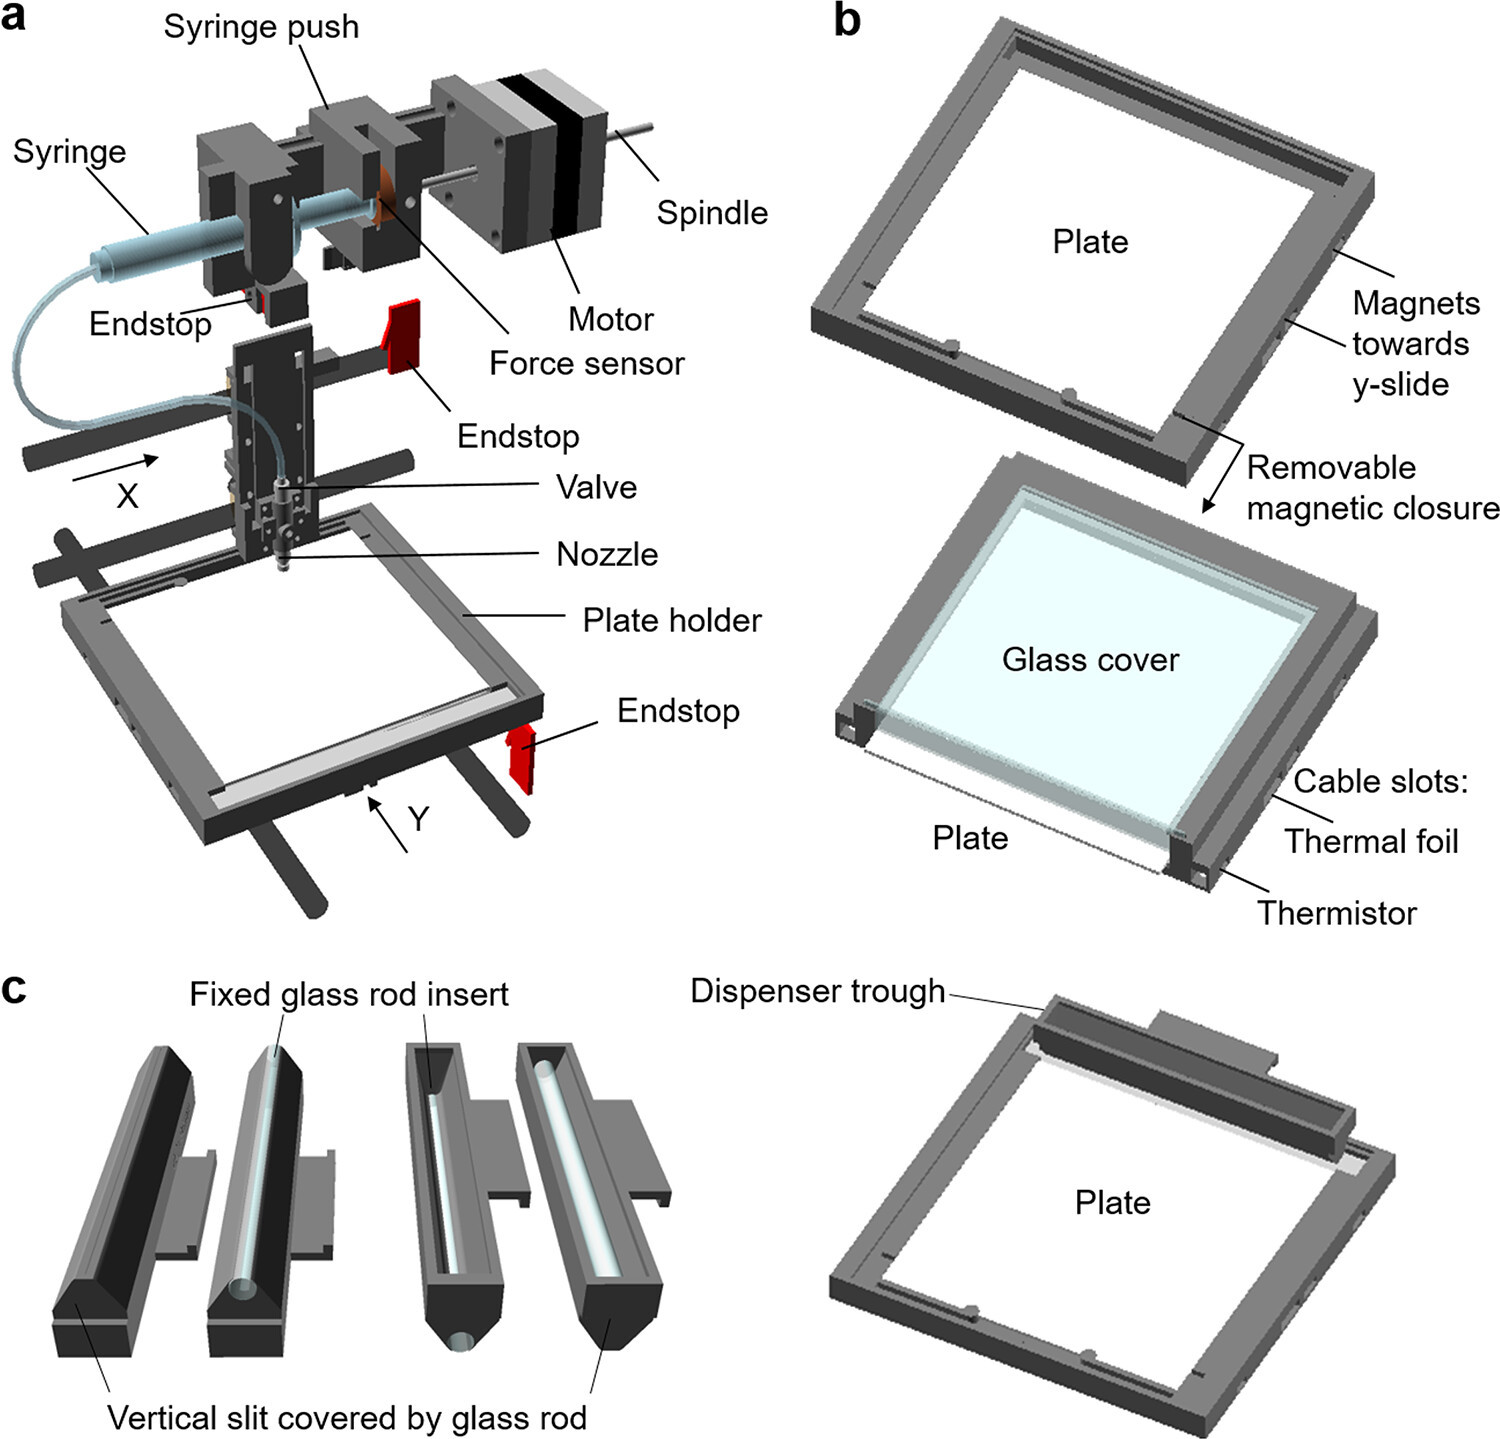
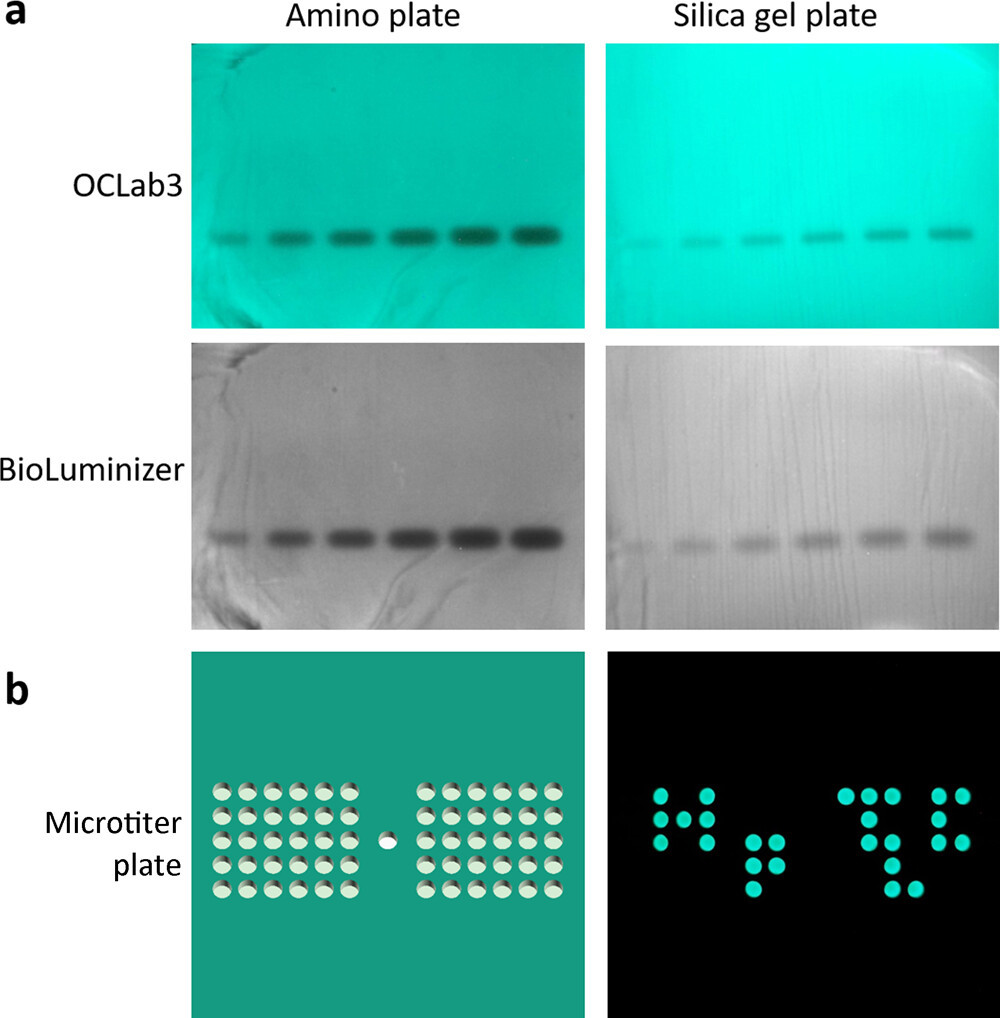
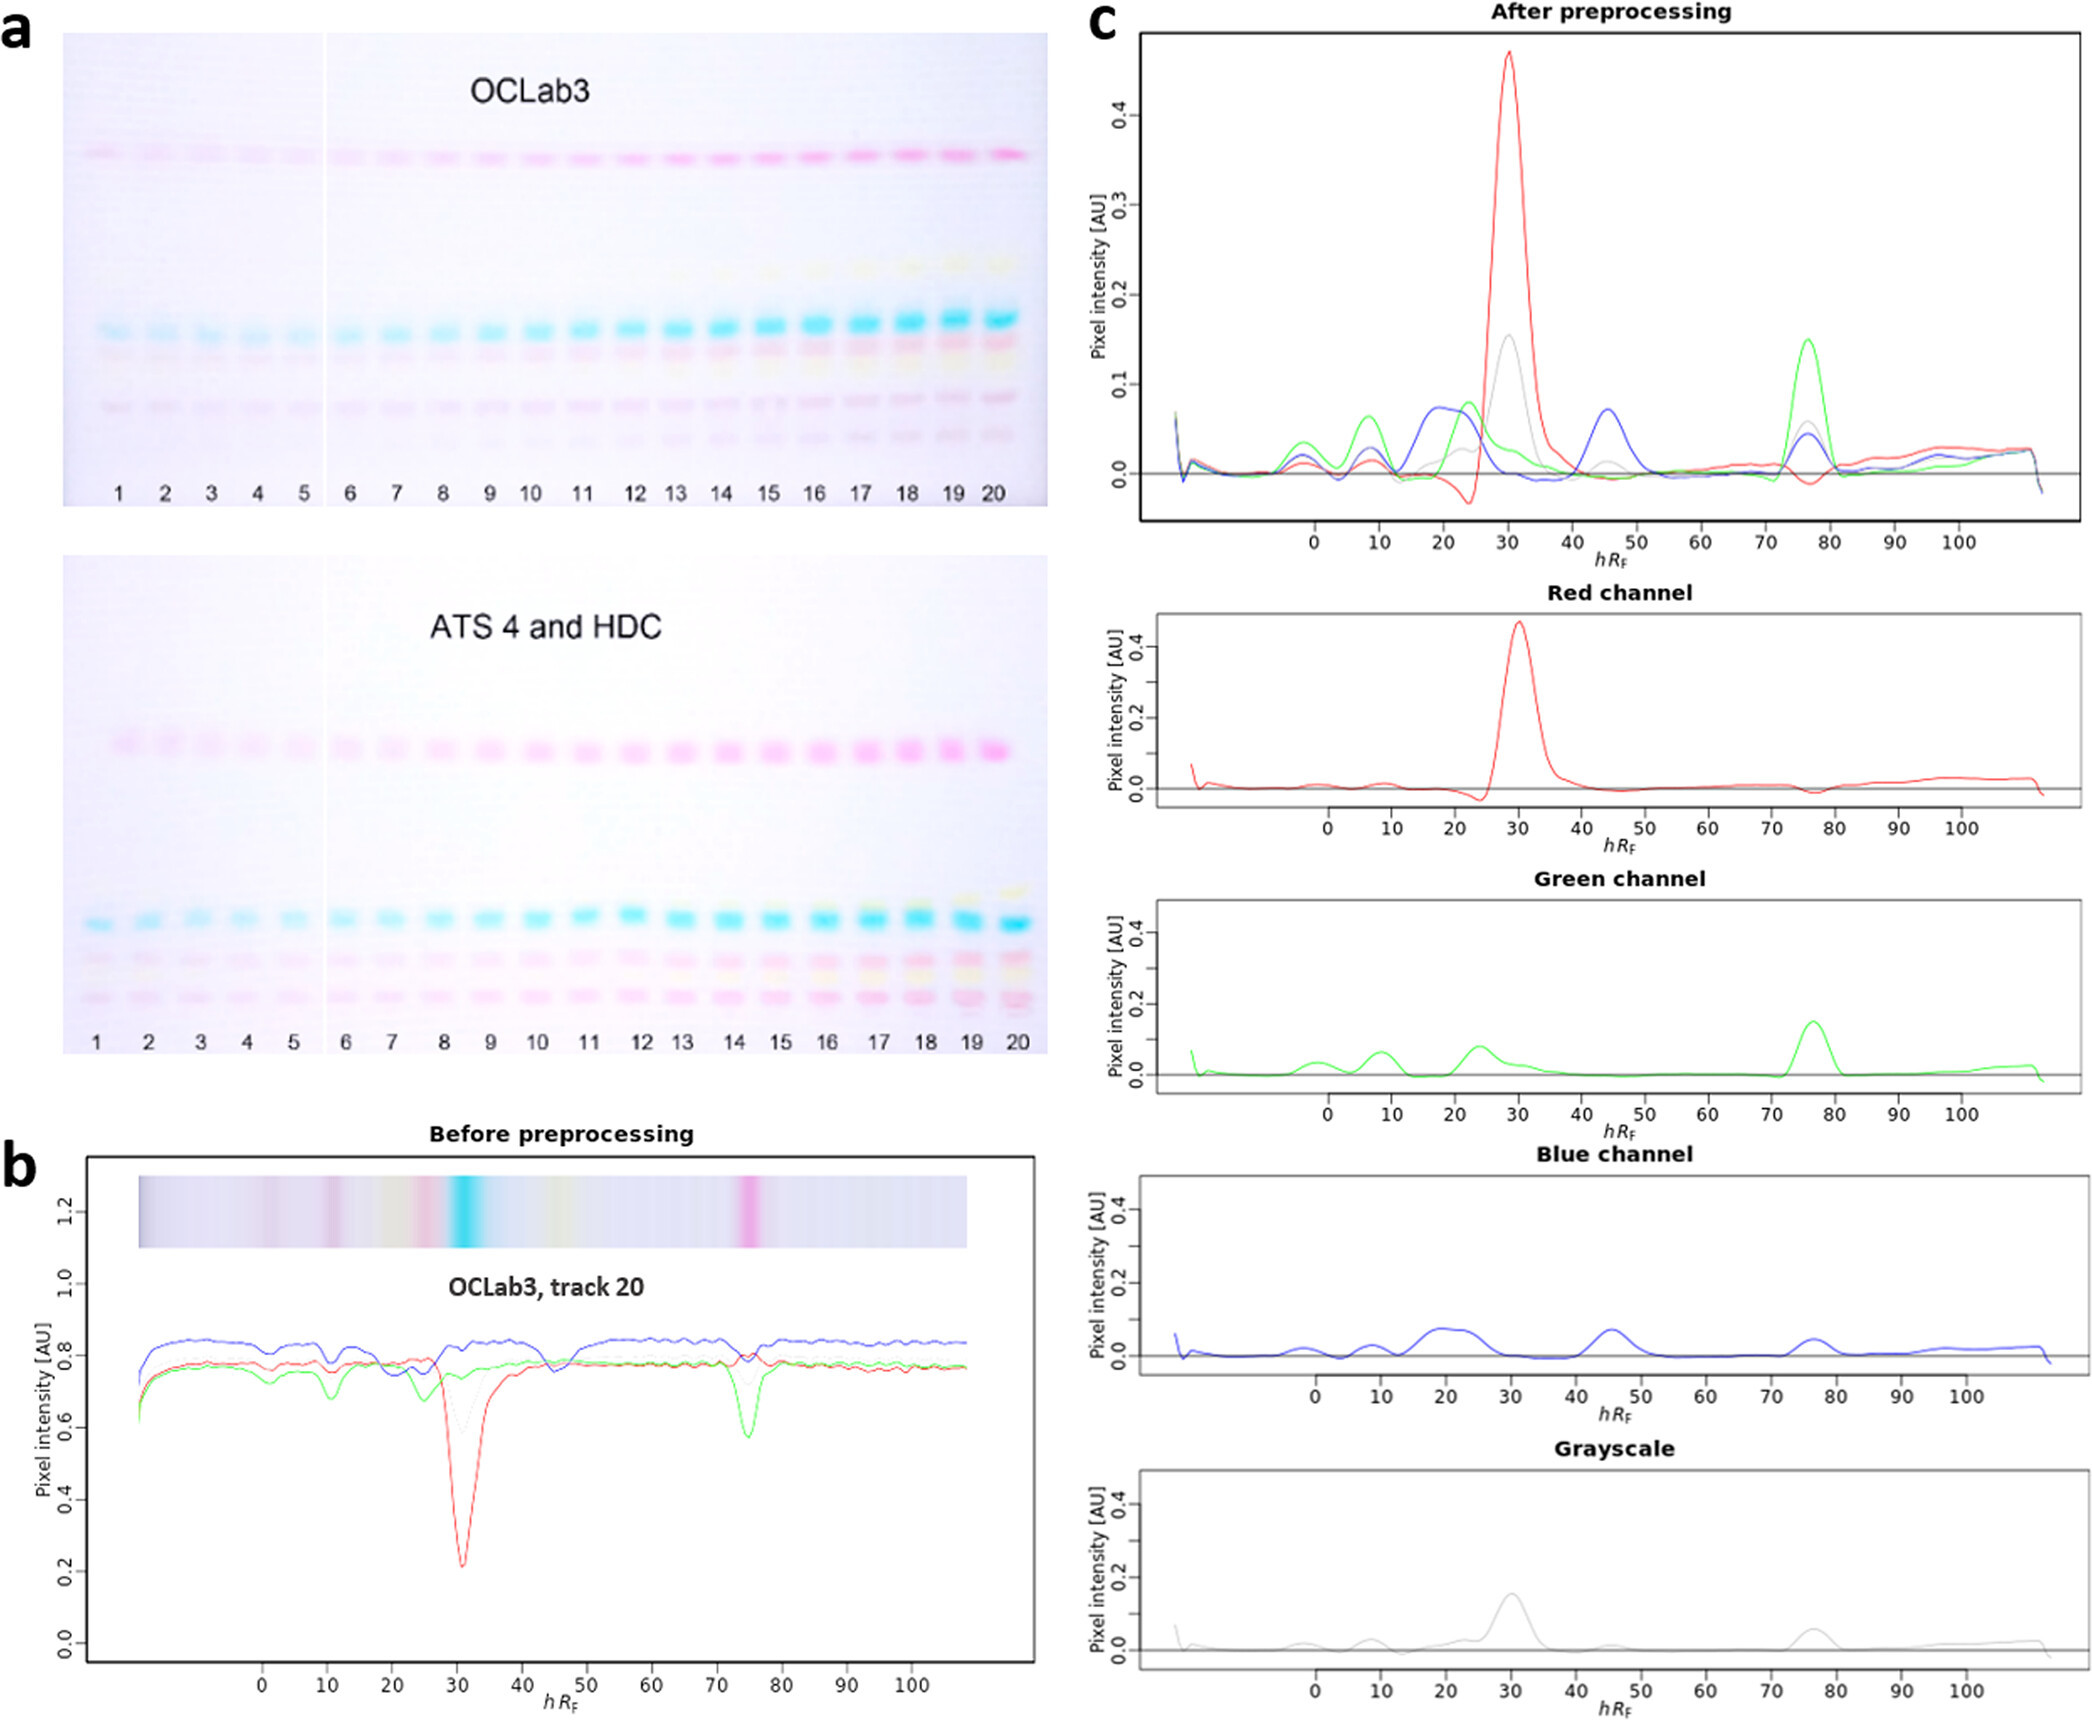
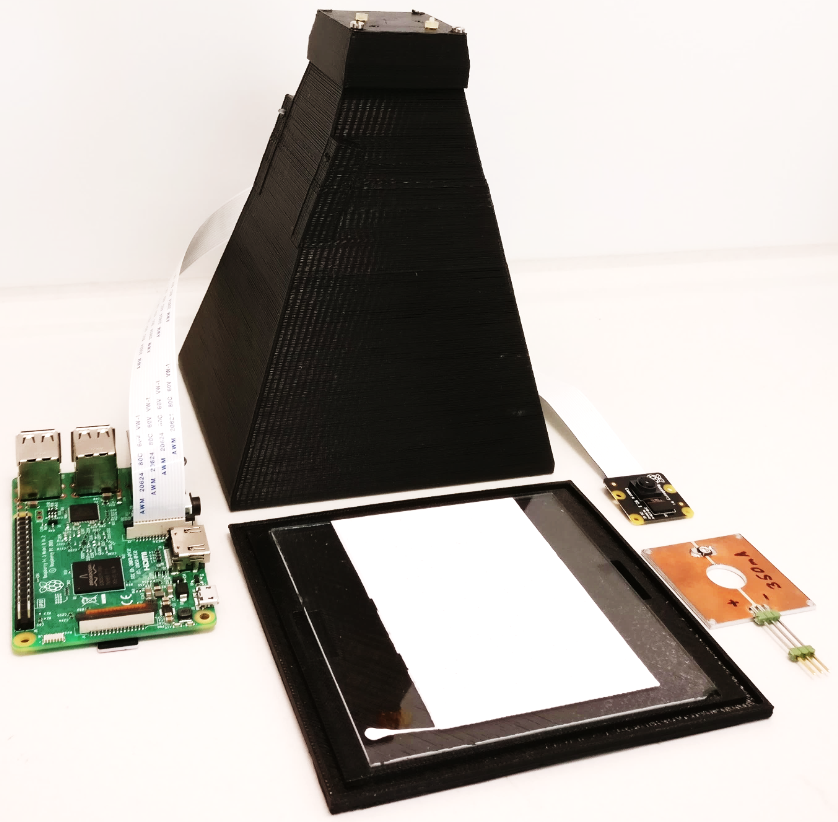
Office Chromatography: Miniaturized all-in-one #OpenSource system for planar #chromatography:
-article unfortunately #NOpenAccess
-#3Dprinted
-254 nm #UV #LED illumation
-#Arduino-/#RaspberryPi-/#PiCam-controlled
https://doi.org/10.1021/acs.analchem.8b02866
#DIYbio #lab #instruments #TLC #GCODE

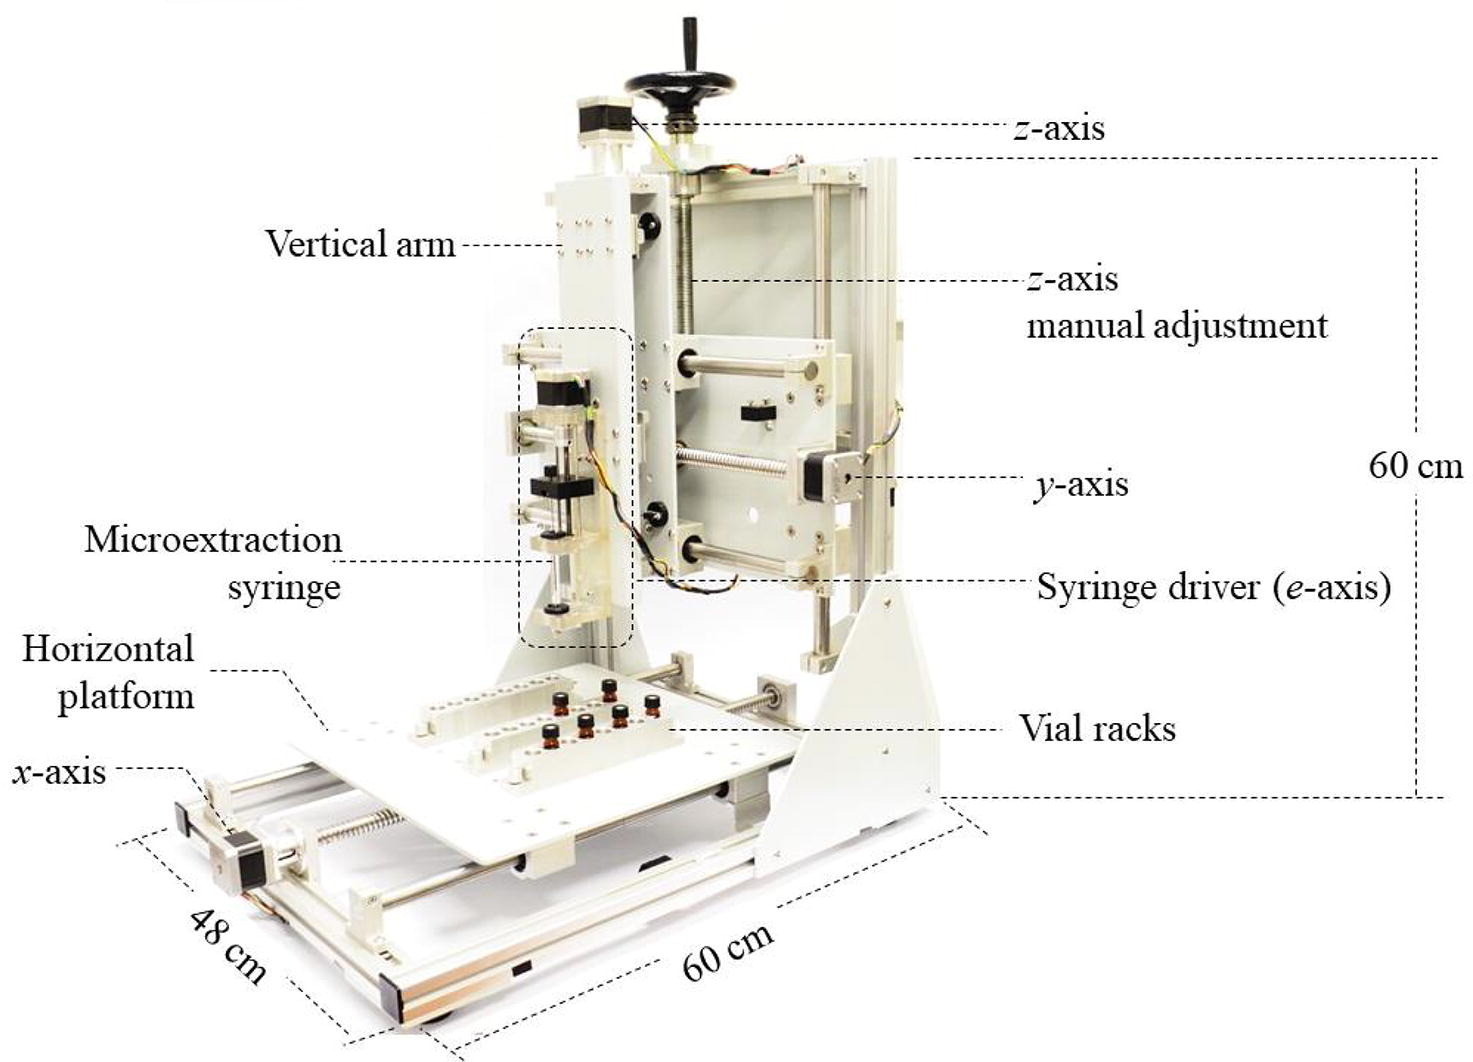
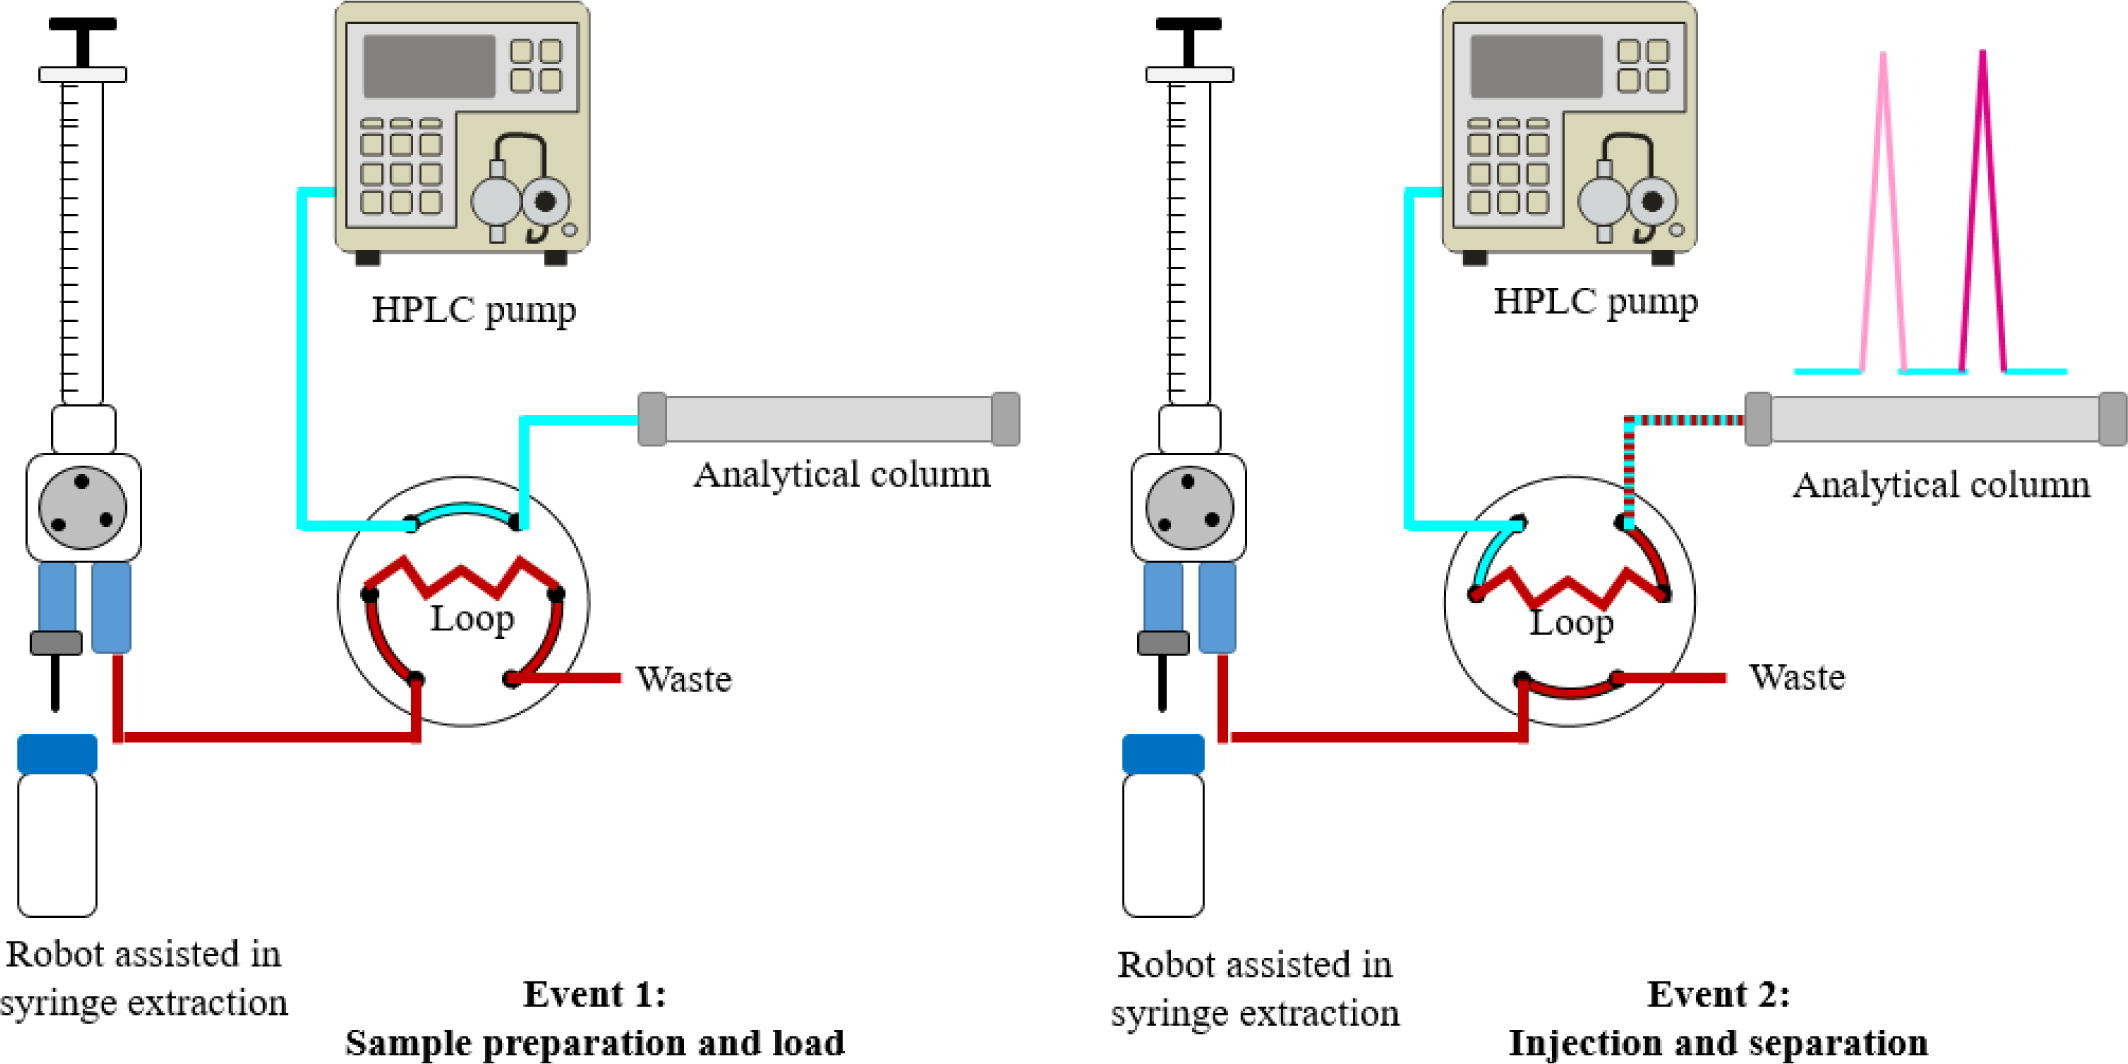
#OpenSource sample treatment platform for #Arduino-#automated integration of #microextraction techniques & #liquid #chromatography analysis:
https://doi.org/10.1016/j.ohx.2019.e00056
#DIYbio #DIYchem #lab #instruments #LC #chemistry #extraction #MS
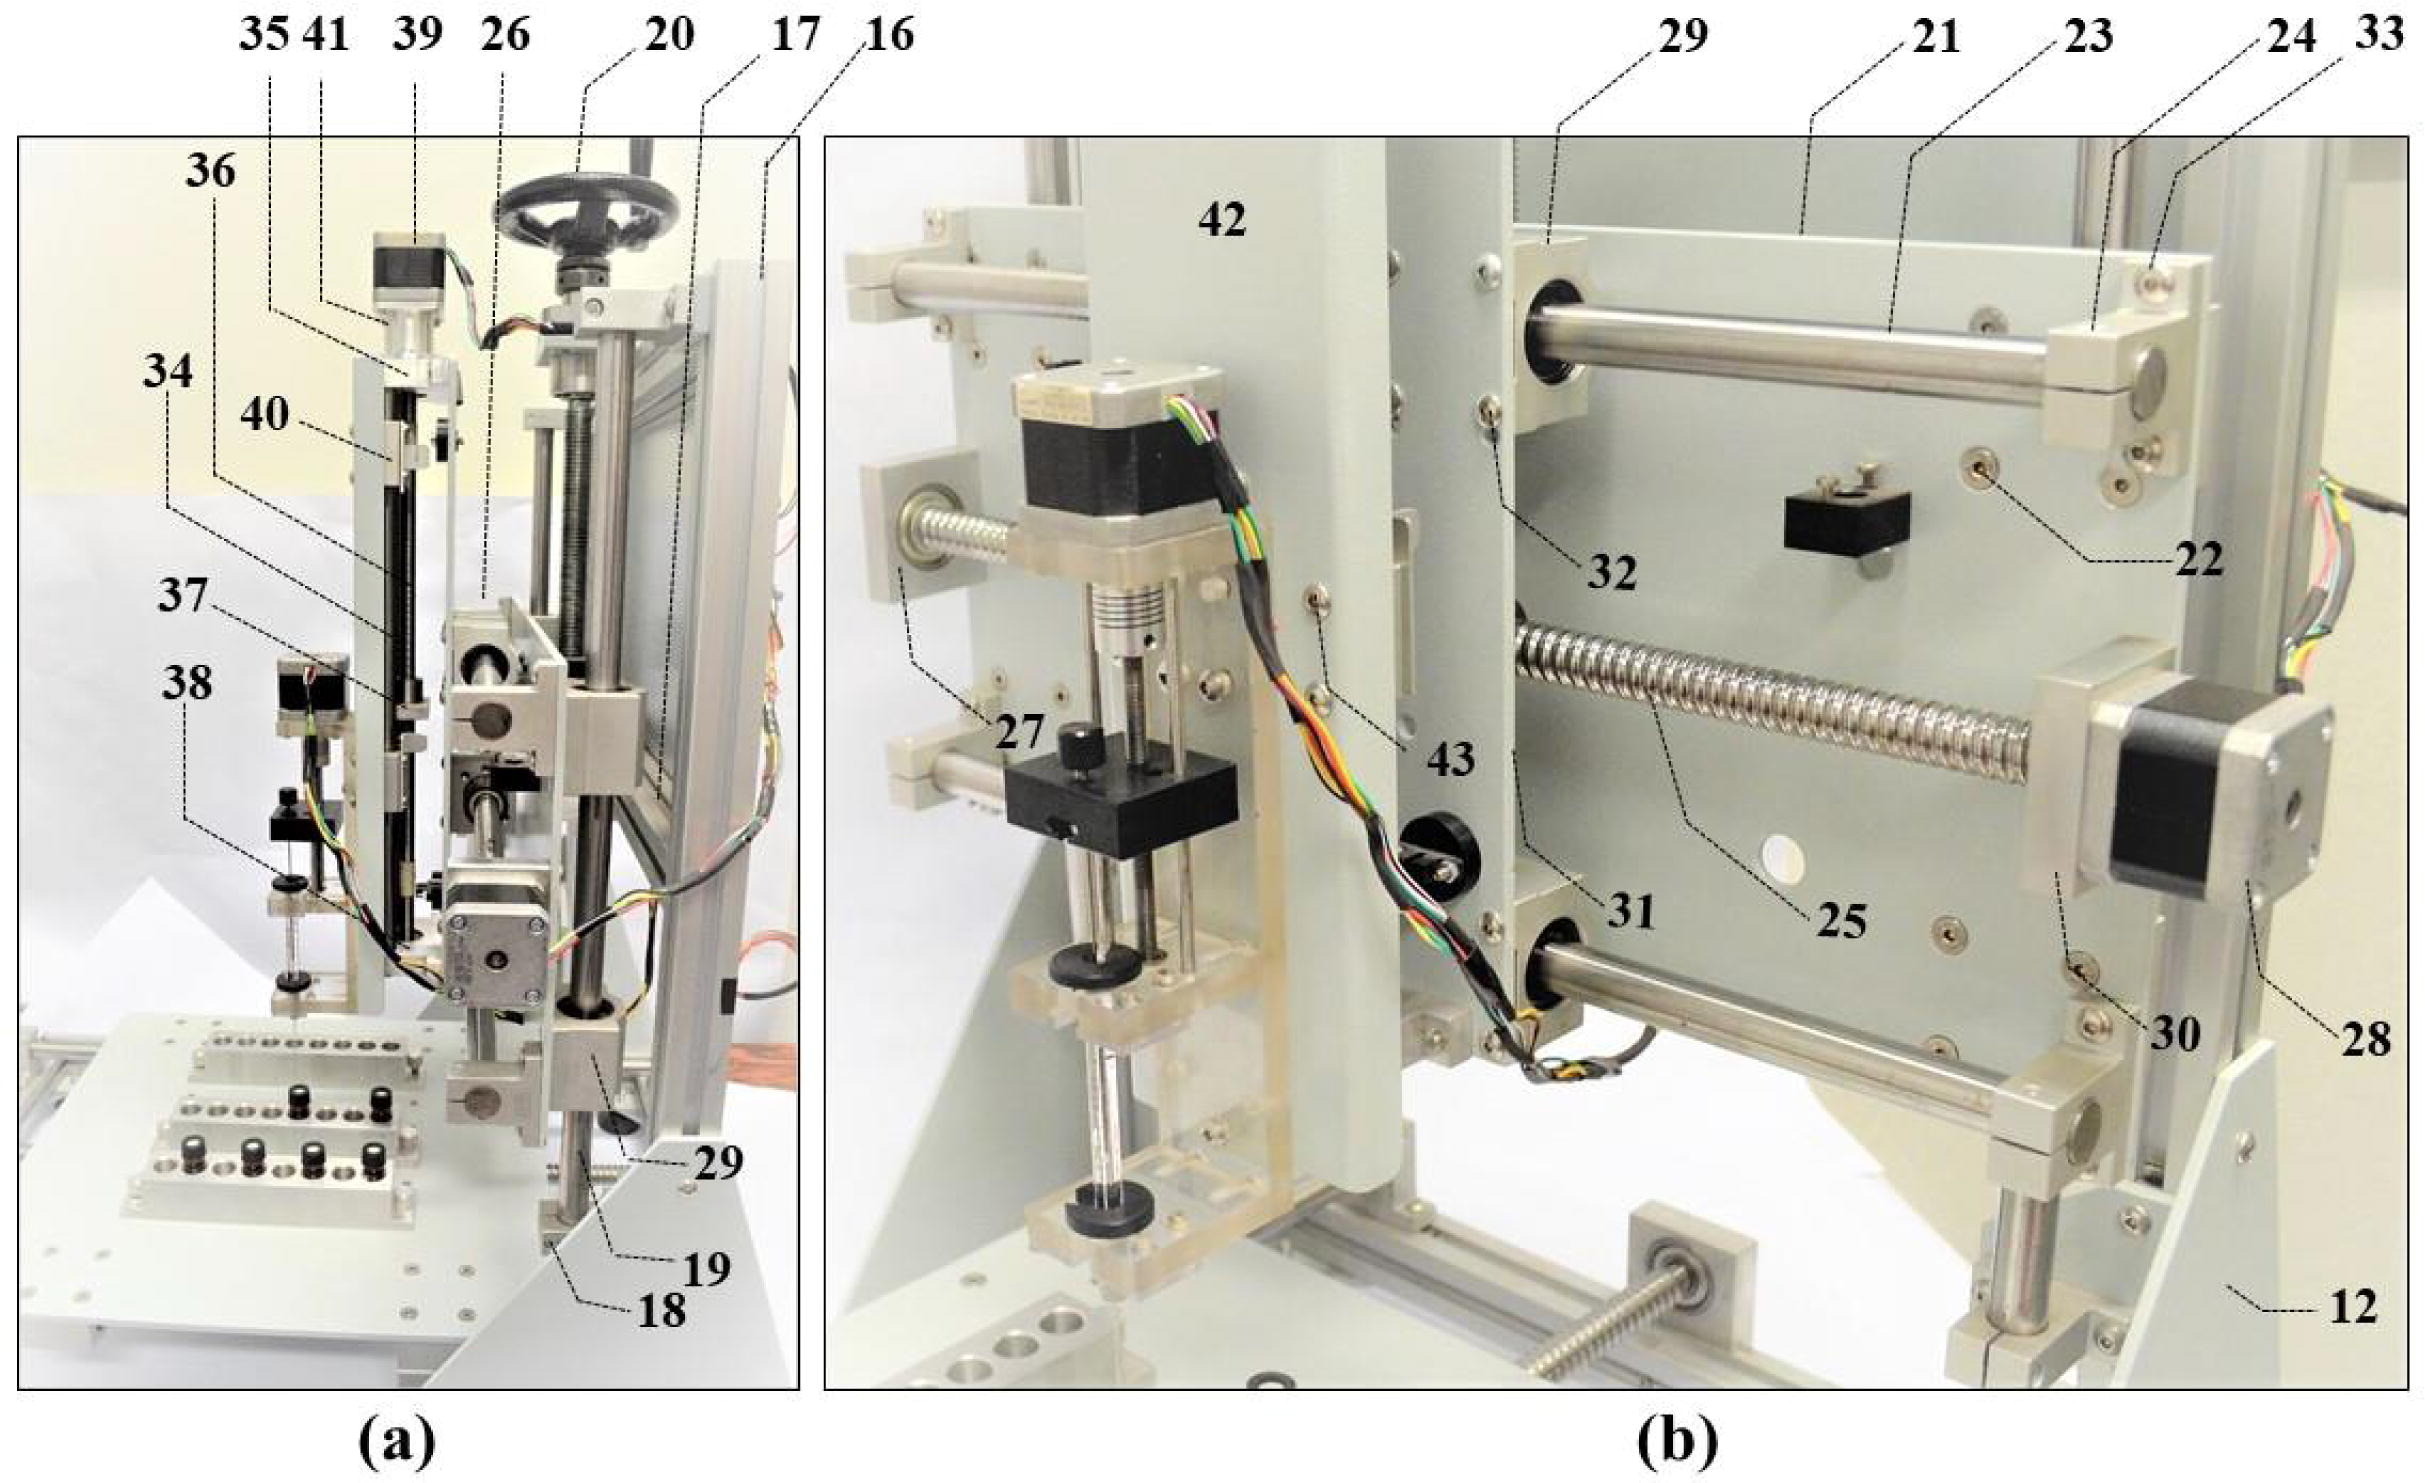
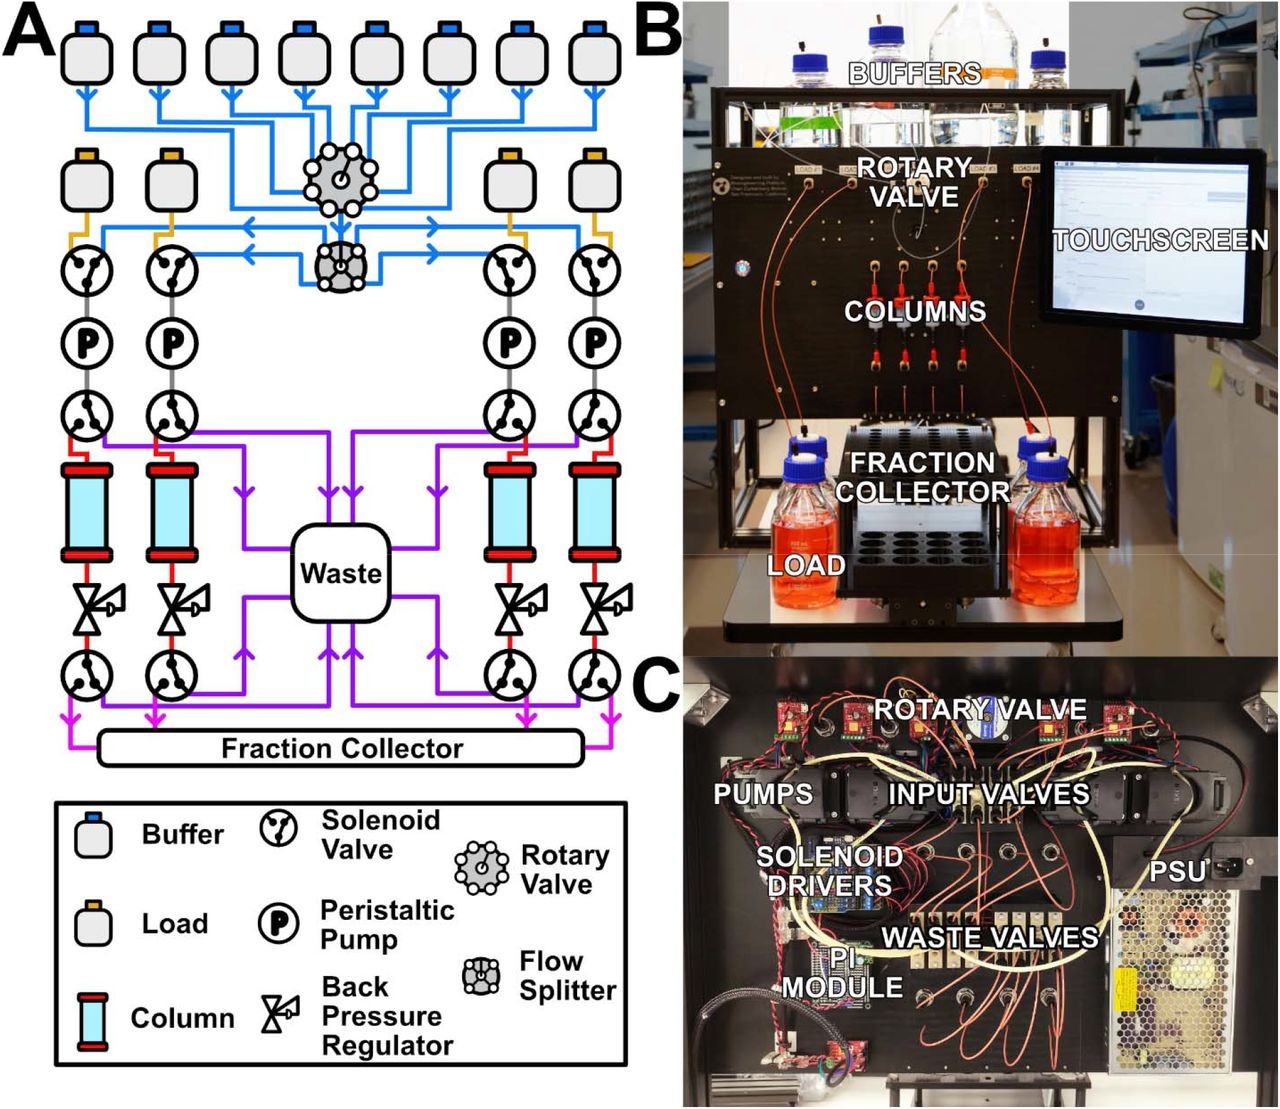
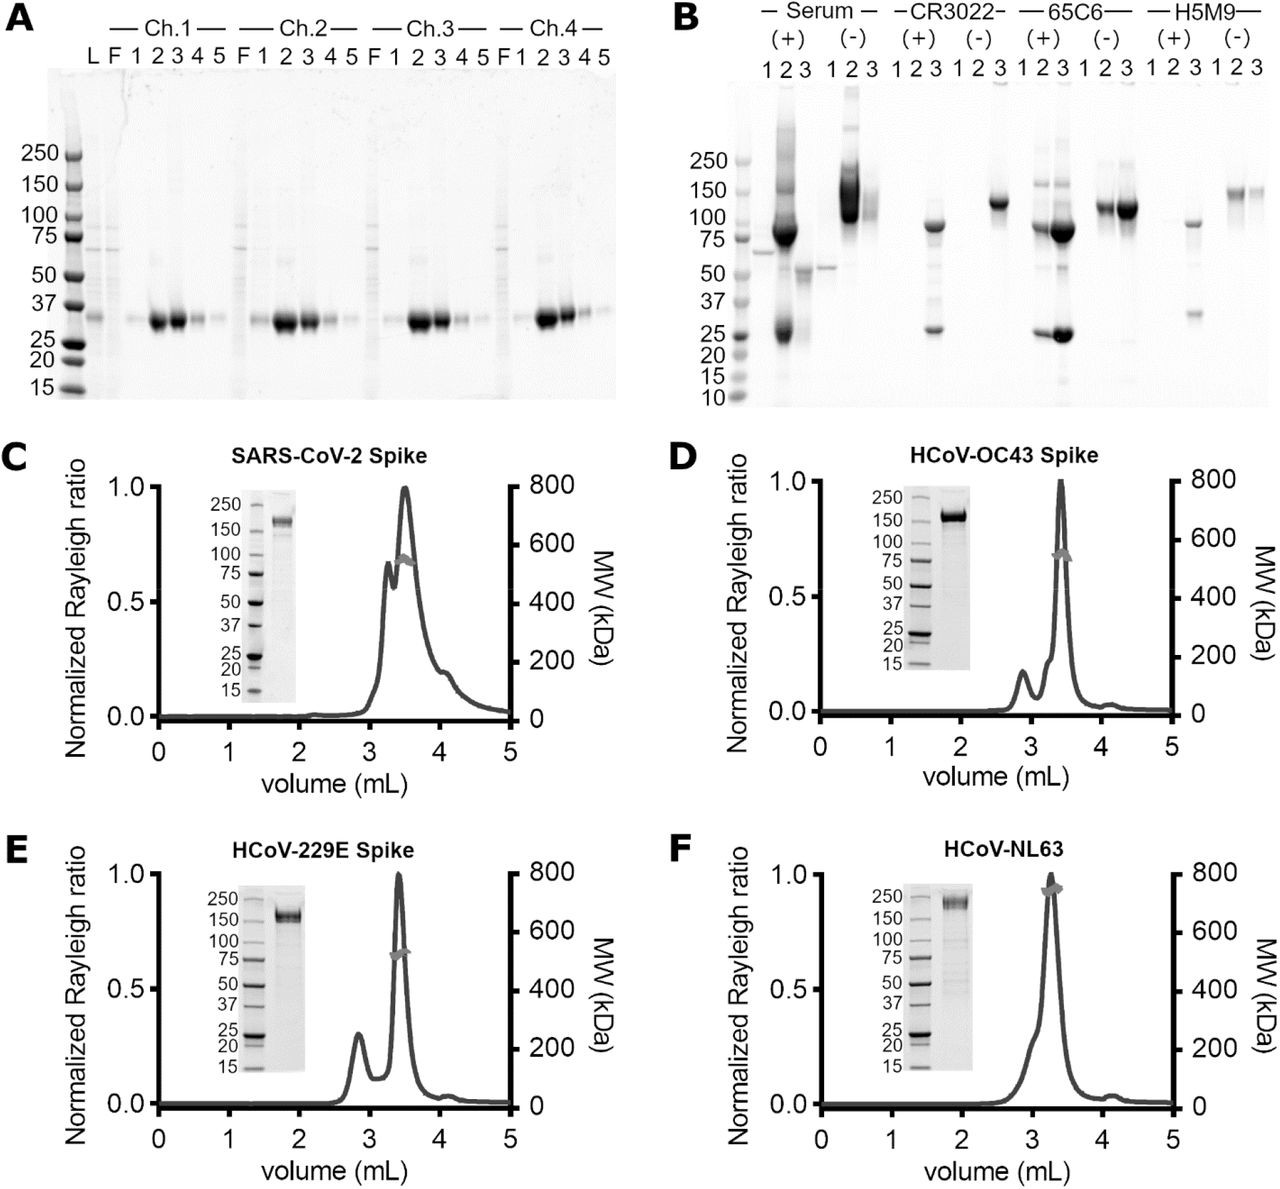
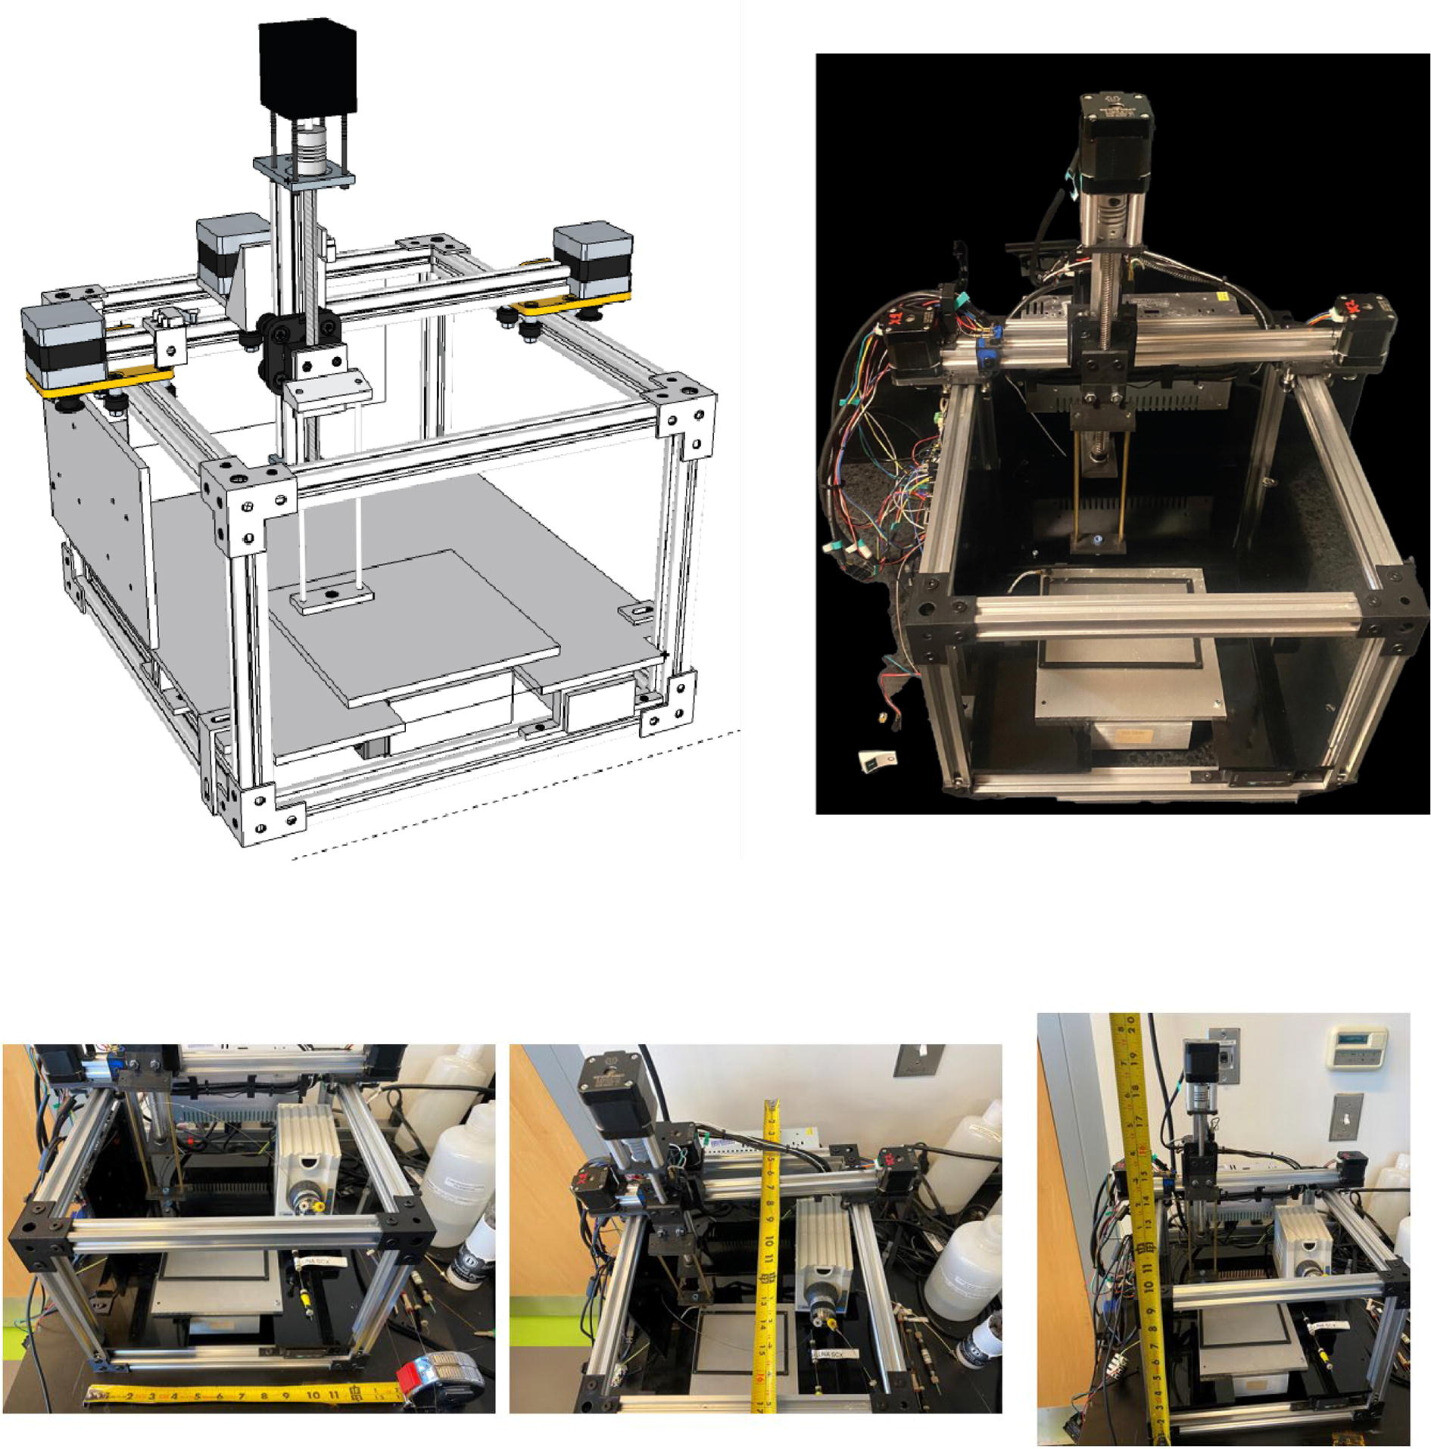
A #RaspberryPi-#automated #OpenSource milligram-scale, four channel #protein #purification system based on liquid #chromatography:
https://doi.org/10.1101/2023.08.09.552685
#DIYbio #lab #instruments #LC #FPLC

Continued thread

Inspiring to read how the #Colour4CRAFTS project is using this historical research on materials & techniques to generate ideas for more sustainable bio-based dyeing:
https://www.helsinki.fi/en/researchgroups/bio-based-colourants/about-colour4crafts  2/3
2/3
University of HelsinkiAbout Colour4CRAFTS | Bio-based Colourants | University of HelsinkiFunded by EU Horizon, Colour4CRAFTS is a consortium project that combines the cultural traditions of dyes and textiles, with the development of novel dyeing techniques and bio-based dyes using state-of-the-art technology.
Replied in thread

@FaithfullJohn I, very successfully, used the cut and weigh method to quantify chromatographic peaks. In an attempt to increase the mass of each peak (and therefore, I reasoned, precision) I tried photocopying onto OHP sheets but quickly found the precision was worse... I figured the thickness of the OHP sheets was less consistent than paper. But this was 40 years ago...
#chromatography #ChemicalAnalysis #quantification
#Colosseum: A <$100, #3Dprinted, scalable & #Arduino-#automated #OpenSource fraction collector:
Paper: https://doi.org/10.1016/j.ohx.2021.e00201
YouTube: https://www.youtube.com/watch?v=yG7ECh5GO0o
Build instructions: https://doi.org/10.5281/zenodo.4677604
GIF
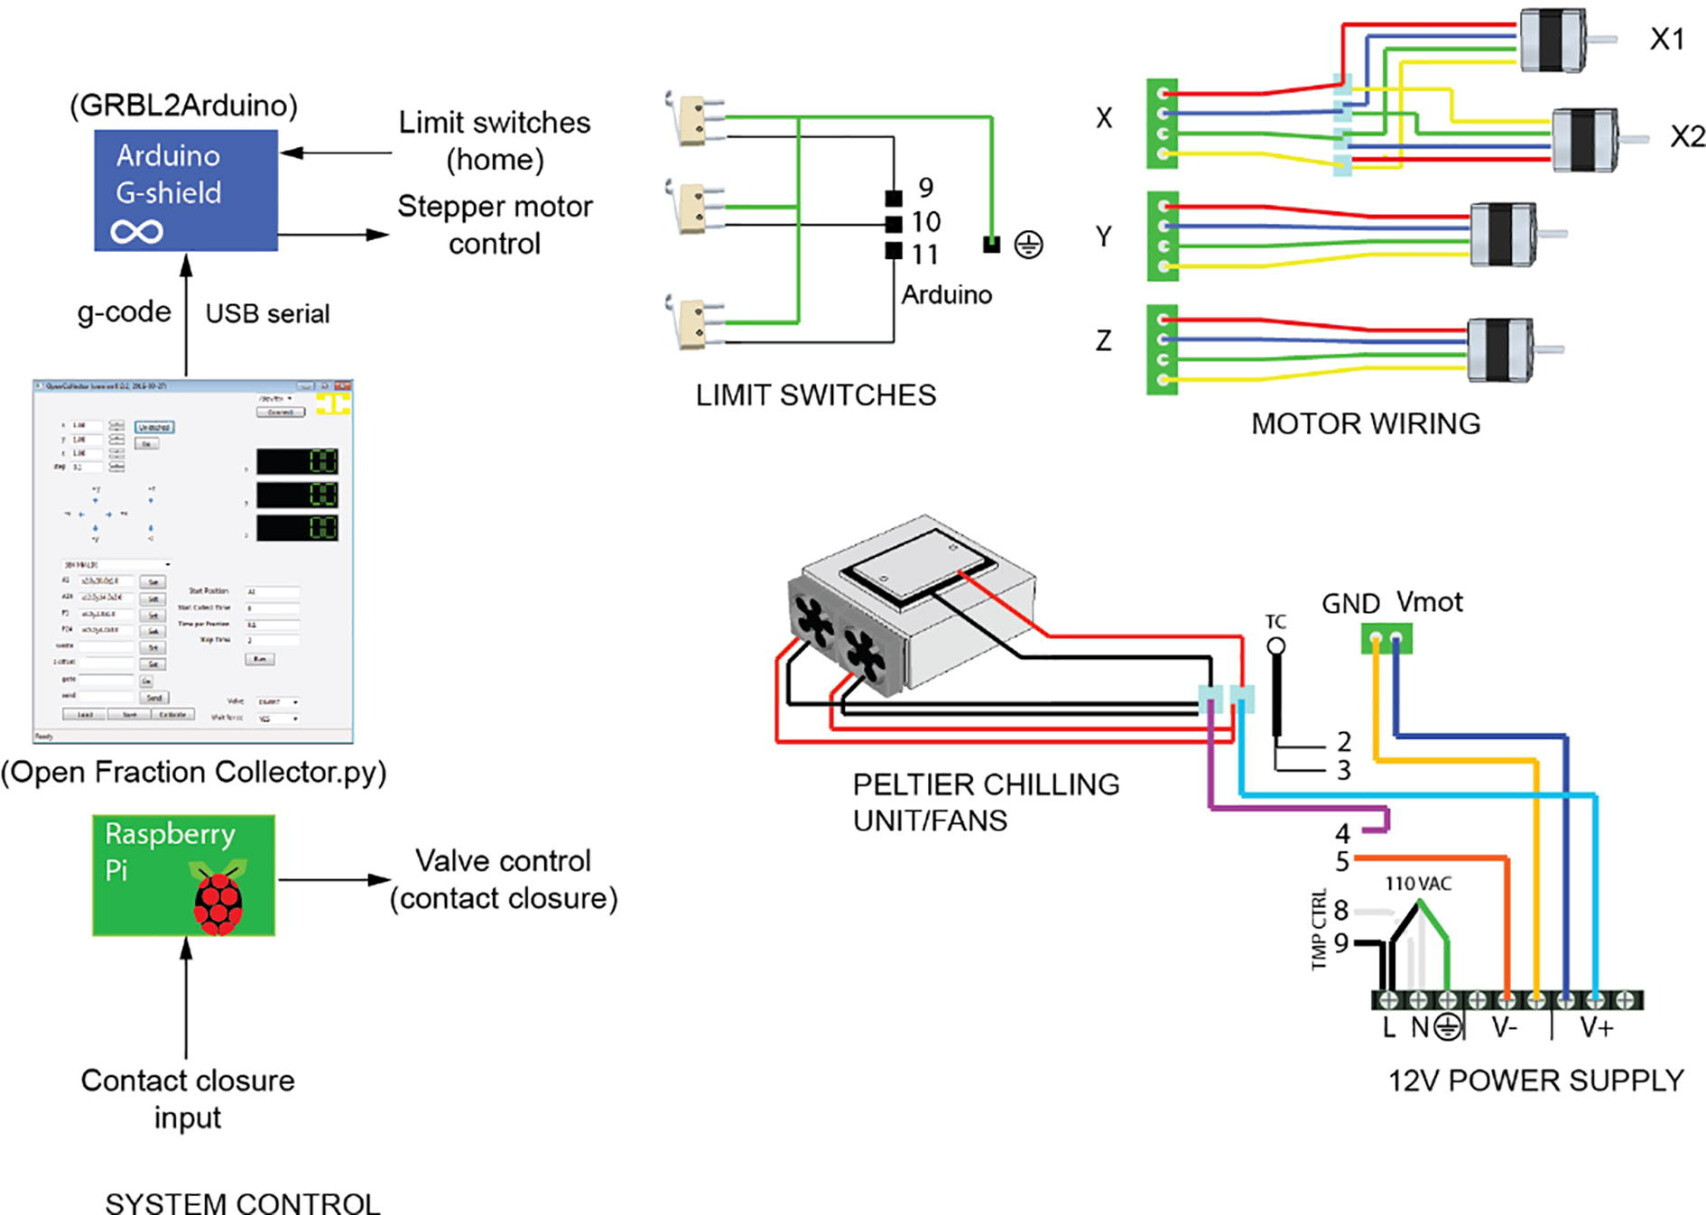
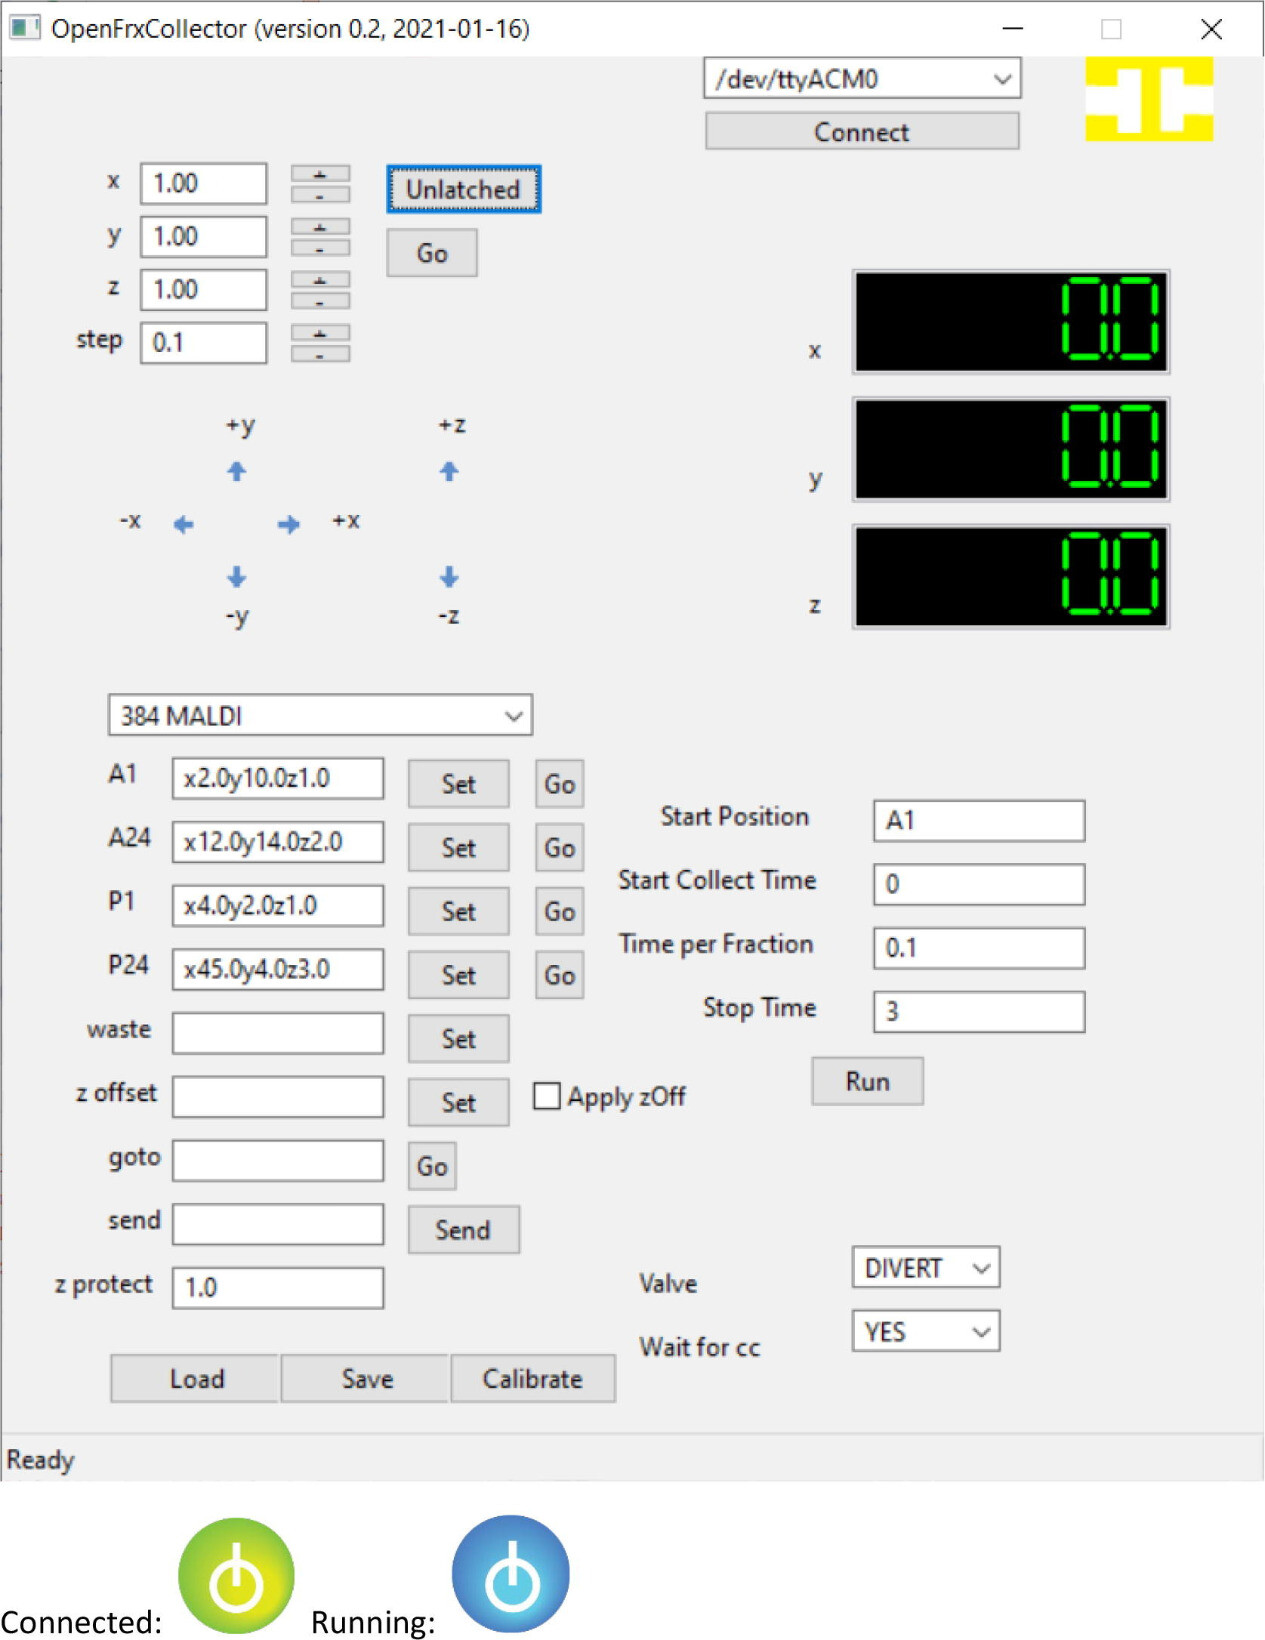
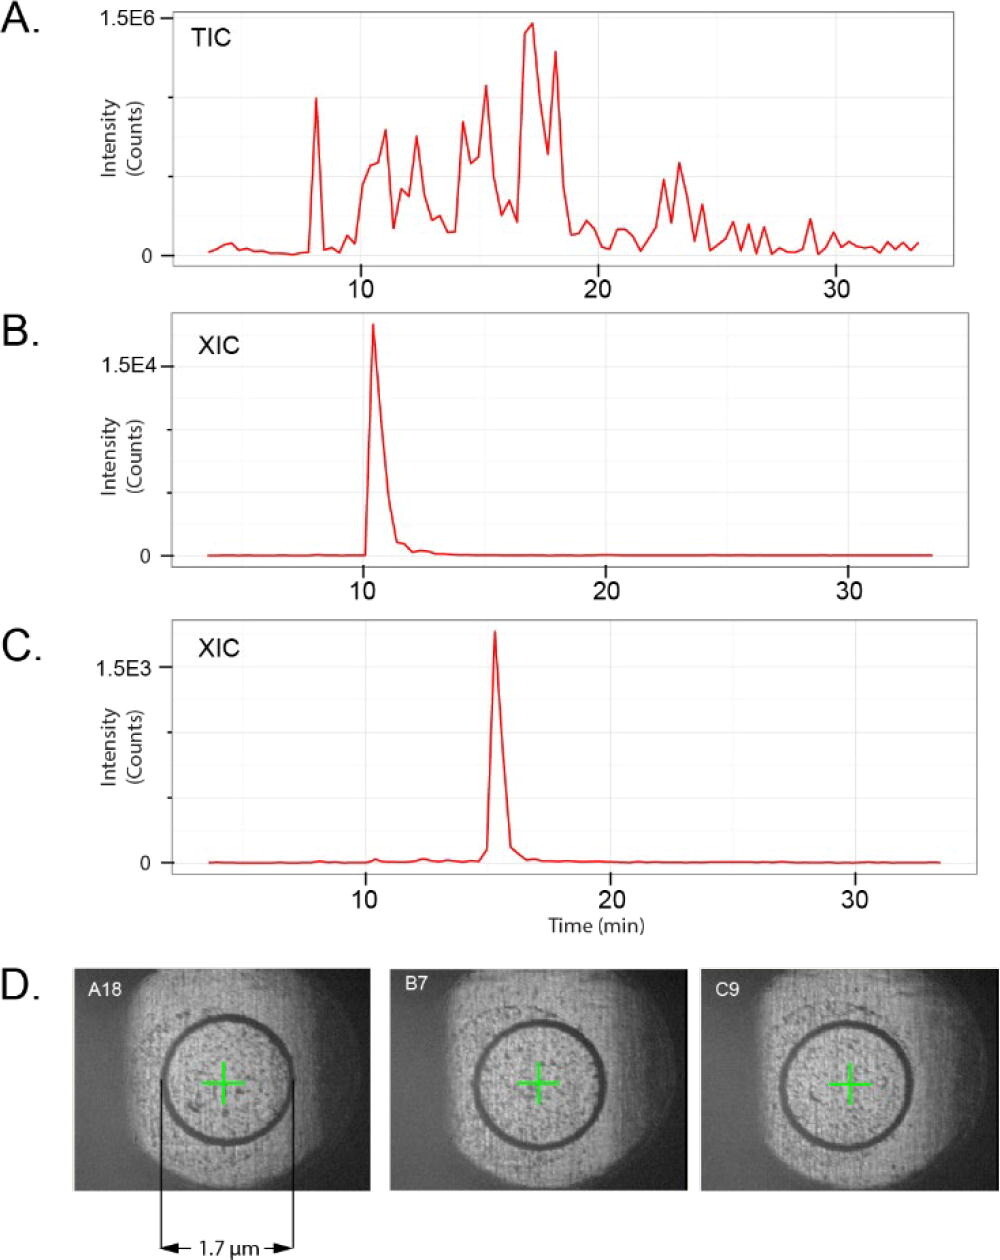
#OpenSource #Arduino/#RapberryPi/#Python/#Linux-controlled fraction #collector/#MALDI mass #spectrometry spotter for #proteomics:
-#Peltier thermo-electric cooling module
https://doi.org/10.1016/j.ohx.2022.e00305
#chemistry #DIYbio #lab #instruments #MS #LC #HPLC #chromatography #analytics

I spent SO MANY HOURS in grad school manually adjusting peak baselines and deciding what should or shouldn't count as a peak and then going back and doing it all again because I called it a peak in one sample but not the other. I'm SO happy that progress is being made on this problem and very excited to read this preprint!
https://www.biorxiv.org/content/10.1101/2023.07.28.551024v1
#GCMS #LCMS #XCMS #AnalyticalChemistry #Chromatography
#Metabolomics
bioRxivPicky with peakpicking: assessing chromatographic peak quality with simple metrics in metabolomicsChromatographic peakpicking continues to represent a significant bottleneck in automated LC-MS workflows. Uncontrolled false discovery rates and the lack of manually-calibrated quality metrics require researchers to visually evaluate individual peaks, requiring large amounts of time and breaking replicability. This problem is exacerbated in noisy environmental datasets and for novel separation methods such as hydrophilic interaction columns in metabolomics, creating a demand for a simple, intuitive, and robust metric of peak quality. Here, we manually labeled four HILIC oceanographic particulate metabolite datasets to assess the performance of individual peak quality metrics. We used these datasets to construct a predictive model calibrated to the likelihood that visual inspection by an MS expert would include a given mass feature in the downstream analysis. We implemented two novel peak quality metrics, a custom signal-to-noise metric and a test of similarity to a bell curve, both calculated from the raw data in the extracted ion chromatogram and found that these outperformed existing measurements of peak quality. A simple logistic regression model built on two metrics reduced the fraction of false positives in the analysis from 70-80% down to 1-5% and showed minimal overfitting when applied to novel datasets. We then explored the implications of this quality thresholding on the conclusions obtained by the downstream analysis and found that while only 10% of the variance in the dataset could be explained by depth in the default output from the peakpicker, approximately 40% of the variance was explained when restricted to high-quality peaks alone. We conclude that the poor performance of peakpicking algorithms significantly reduces the power of both univariate and multivariate statistical analyses to detect environmental differences. We demonstrate that simple models built on intuitive metrics and derived from the raw data are more robust and can outperform more complex models when applied to new data. Finally, we show that in properly curated datasets, depth is a major driver of variability in the marine microbial metabolome and identify several interesting metabolite trends for future investigation.
### Competing Interest Statement
The authors have declared no competing interest.

RT @: Depletion of abundant #plasma #proteins for #extracellular #vesicle proteome characterization: benefits and pitfalls
by Sandrine Reymond et al @UNIGEnews @unige_en #proteomics #chromatography #EVs #biomarker
#OpenAccess
https://link.springer.com/article/10.1007/s00216-023-04684-w…
Continued thread

We have prepared a list of "most wanted" columns, see here: https://bio.informatik.uni-jena.de/2023/04/most-wanted-tanaka-and-hsm-parameters-for-rp-columns/ #chromatography Please let us know if you know parameters for those columns! #metabolomics #lipidomics
bio.informatik.uni-jena.deMost wanted: Tanaka and HSM parameters for RP columns | Lehrstuhl Bioinformatik JenaA few years ago, Michael Witting and I joined forces to get a transferable prediction of retention times going: That is, we want to predict retention times (more precisely, retention order) for a column even if we have no training data for that column. Yet, to describe a column to a machine learning model, you
Michael Witting and my lab need your help: Do some #chromatography nerds in our Mastodon bubble know a good source of HSM and/or Tanaka parameter describing RP columns? Do you happen to have measured some yourself? Help is much appreciated! #metabolomics #lipidomics
If anyone wants to enter to win a free combiflash system you'll lower my chances so you have to promise to take some ridiculous photos with it:
info.teledynepharma.comTeledyne ISCO Golden CombiFlash CelebrationEnter to win a Golden CombiFlash NextGen 300+ by Teledyne ISCO.

Chaps
Who did taps
Aren't tapping anymore
They're doing #chromatography
